Analysing the Chart with Waves and Fibonacci Levels
727 views · Published 28 July 2017 · 52:08 · Indexed 16 November 2026
Channel: Admirals · 2017 · Education
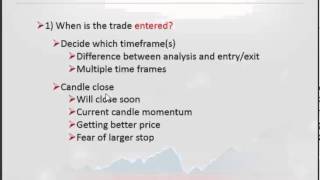
The EUR/USD and USD/JPY are intensively analysed for the 'path of least resistance' by using wave patterns, charts patterns, and Fibonacci patterns. Candlestick patterns are then used to confirm the analysis for the potential trading plan and entries
More from this channel
-
 5:06
Day Trading Strategies
-
 5:24
Introduction to Forex Market
-
 5:11
MetaTrader 4 Review and the Basics of Technical Analysis
-
 1:26:52
A practical guide how to conquer fear in trading
-
 1:04:14
Classical trading the jigsaw puzzle
-
 1:06:43
Intra day trading the gbpusd
-
 1:03:36
The Elliott Wave Theory - a fantasy or reality?
-
 1:02:24
The importance of time in your trading