📚 Price Action: How to trade with bullish candlestick chart psychology, candle charting psychology
3,334 views · Published 7 August 2018 · 29:24 · Indexed 31 October 2026
Channel: BO Turbo Trader · 2018 · Education
★★★ BECOME A PRO TRADER! ★★★

"Binary options are not promoted or sold to retail EEA traders. If you are not a professional client, please leave this page."

Reliable Binary Options Broker with a ★Profit of up to 100%★! Totally Free $10000 Demo account!

✅ Register and Get Best Trading Strategy ➤➤ https://cutt.ly/iq1

✅ #1 IQ Option ► https://cutt.ly/iq2

✅ #2 PocketOption ►https://goo.gl/Hs2a9k

✅ #3 Exnova ► https://cutt.ly/exnova

✅ #4 SabioTrade ► https://cutt.ly/jwSdeU1j

✅ #5 Quadcode  ► https://cutt.ly/RwSdruS8

🏬 BOTT Store ► https://goo.gl/Em3HHj

💡 Get a consultation ► https://www.wisio.com/boturbotrader "RISK WARNING: YOUR CAPITAL MIGHT BE AT RISK"
This video is not an investment advice.

"CFDs are complex instruments and come with a high risk of losing money rapidly due to leverage. Between 74-89% of retail investor accounts lose money when trading CFDs. You should consider whether you understand how CFDs work and whether you can afford to take the high risk of losing your money."

Binary Options Turbo Trader (#BOTT)
https://goo.gl/95wWoZ

Forex (FX) Turbo Trader (FOTT)
https://goo.gl/GcPh46

DO (Digital Options) Turbo Trader (DOTT)
https://goo.gl/DRThwk

🎓 Join the BOTT Mentorship Program!
📧 [email protected]

🎬 BOTT Mentorship Self-Study Video Packs
https://goo.gl/DkDFqb

📚 BO Turbo Trader Price Action Guide for Binary Options Trader PDF
https://goo.gl/J2aUqe

📚 BO Turbo Trader Price Action Bible for Binary Options Trader PDF
https://goo.gl/en48Ux

👉 SMASH THE LIKE BUTTON 👈
👉 HIT THE SUBSCRIBE BUTTON 👈
👉 LEAVE A COMMENT 👈
👉 SHARE 👈


Facebook-Group: https://www.facebook.com/groups/boturbotrader/

Twitter:
https://twitter.com/boturbotrader

Blogger:
https://boturbotrader.blogspot.com/


Risk Warning: Your invested capital may be at risk.
This video is not an investment advice.

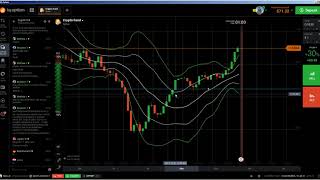
Indicators:
EMA 3     (blue)
EMA 20   (yellow)
EMA 50   (orange)
EMA 100 (red)
EMA 200 (purple)

Bollinger Band Period 20 Deviation 2 (green)
Bollinger Band Period 20 Deviation 1 (white)

A candlestick chart (also called Japanese candlestick chart) is a style of financial chart used to describe price movements of a security, derivative, or currency. Each "candlestick" typically shows one day, thus a one-month chart may show the 20 trading days as 20 "candlesticks". In technical analysis, a candlestick pattern is a movement in prices shown graphically on a candlestick chart that some believe can predict a particular market movement. The recognition of the pattern is subjective and programs that are used for charting have to rely on predefined rules to match the pattern.

BULLISH HAMMER: This pattern occurs at the bottom of a trend or during a downtrend and it is called a Hammer since it is hammering out of a bottom. It is a single candlestick pattern that has a long lower shadow and a small body at or very near the top of its daily trading range. Traders of stocks and other financial markets often use candlesticks as a great visual aid to what a particular price has done within a certain time period.

A hammer is a type of bullish reversal candlestick pattern, made up of just one candle, found in price charts of financial assets. Two additional things that traders will look for to place more significance on the pattern are a long lower wick and an increase in volume for the time period that formed the hammer. Bullish Doji Star Reversal Pattern.


candlestick charting psychology
candlestick psychology
candle charting psychology
candlestick psychology pdf
how to read candle wicks
candlestick math pdf
mastering candlestick math
predicting next candlestick
candlestick secrets
candlestick patterns
candlestick patterns explained with examples


Optimism
Exitement
Thrill
Euphoria
Anxiety
Denial
Fear
Desperation
Panic
Capitulation
Despondency
Depression
Hope
Relief

the cycle of market emotions chart
market emotions cycle graph
stock market emotional cycle
cycle of investor emotions
market cycle psychology
cycle of emotions
examples of changes in market conditions
market conditions affecting business
market conditions synonym
false breakout
Failed Break
False-breakouts
breakout chart
breakout trading

how to avoid false breakouts
false breakout indicator mt4
false breakout meaning
false breakout definition
how to find false breako
snr
snr zones
snr meaning
support and resistance forex
More from this channel
-
 13:15
💵 How to make 100% net profit in 13 minutes and 14 seconds - IQ Option Trader
-
 11:46
📈 Price Action: How to trade Spinning Tops / High Wave Candlesticks the right way - BO Turbo Trader
-
 10:47
📈 Price Action: How to trade Engulfing Candlestick Pattern the right way - IQ Option
-
 19:38
📈 Price Action: How to spot fake setup and false Candlesticks and avoid them - IQ Option - BO Turbo
-
 9:07
💵 77% net profit in 8 minutes on iq option real account and iq option tutorial
-
 5:42
💵 77% net profit in 5 minutes on IQ Option Real Account Strategy and IQ Option Real Account Tricks
-
 4:50
💵 85% net profit in 4 minutes IQ Option REAL Account Trading Method and iq option live trading
-
 4:11
💵 64% net profit in 3 minutes on iq option tips and tricks iq option real account tricks