The wonder of statistics
301 views · Published 2 July 2018 · 51:12 · Indexed 30 October 2026
Channel: Tableau · 2018 · Science & Technology
We all love data. But sometimes it doesn't quite support the point you’re trying to make, and it needs a little…help. This session will delve into how people misuse data and visualization, and how to detect when it’s happening to you. Understand how to bias a sample to produce the right results, how to give the impression your data supports the conclusion (even if only weakly related), how to make the most of random correlations in your data, how to utilize weaknesses in human perception to inflate your results, and how to obfuscate the sources of your data to make them seem more authoritative.
More from this channel
-
 6:07
Tableau and Dallas Cowboys Merchandise Management
-
 0:30
Tableau Fun - Dive at 5
-
 2:43
Equinox IT Finds Insight in Millions of Rows of Telco Data
-
 1:56
How Cheyne Capital Uses Tableau
-
 2:07
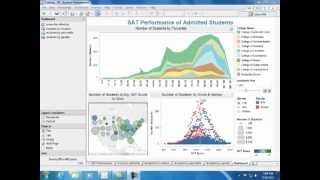
Understanding Admitted Students
-
 2:12
How DePaul Univesity Uses Tableau
-
 3:33
Viz Talk - Apple vs. Microsoft Stock Performance
-
 1:36
How Mercer Uses Tableau