Beautiful data: Balancing art and analysis
550 views · Published 2 July 2018 · 1:03:06 · Indexed 8 November 2026
Channel: Tableau · 2018 · Science & Technology
How do you pull as much meaning from data with as little complexity as possible? Usually via a fine balance between visual presentation, statistics, and calculations. Join this session and discuss the intricate means of balancing art and analysis. We’ll show you how to leap from a paint-by-numbers approach to being a full-on data rock star.
More from this channel
-
 6:07
Tableau and Dallas Cowboys Merchandise Management
-
 0:30
Tableau Fun - Dive at 5
-
 2:43
Equinox IT Finds Insight in Millions of Rows of Telco Data
-
 1:56
How Cheyne Capital Uses Tableau
-
 2:07
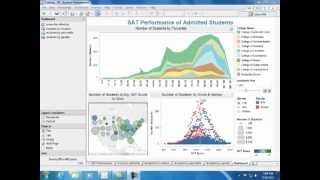
Understanding Admitted Students
-
 2:12
How DePaul Univesity Uses Tableau
-
 3:33
Viz Talk - Apple vs. Microsoft Stock Performance
-
 1:36
How Mercer Uses Tableau