Graphing by Plotting Points - Exponential (L6.3)
2,127 views · Published 14 April 2015 · 8:57 · Indexed 10 November 2026
Channel: Mathispower4u · 2015 · Education
This video explains how to graph an equation by completing a table of values.  The scaling the the horizontal and vertical axes is also discussed.

Content created by Jenifer Bohart and Amy Volpe from Scottsdale CC (License CC-BY-SA 4.0)
More from this channel
-
 6:54
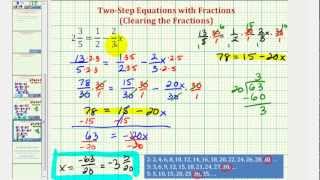
Ex 5: Solving a Two Step Equation with Fractions - Clearing the Fractions
-
 5:51
Ex 5: Solving a Two Step Equation with Fractions - NOT Clearing the Fractions
-
 5:54
Ex 4: Solving a Two Step Equation with Fractions - NOT Clearing the Fractions
-
 5:01
Ex 3: Solving a Two Step Equation with Fractions - NOT Clearing the Fractions
-
 2:34
Ex: Evaluate a Trigonometric Expression: tan(arcsin(-12/13))
-
 6:46
Infinite Series: The Limit Comparison and Ratio Tests - Part 1
-
 6:05
Infinite Series: The Limit Comparison and Ratio Tests - Part 2
-
 4:26
Infinite Series: The Root Test II