US Spending explained with a 360 VR infographic
1,751 views · Published 18 July 2018 · 1:01 · Indexed 19 October 2026
Channel: Paolo Tosolini · 2018 · Science & Technology
http://tosolini.com - How much does the US Government spend on different programs and services? We took on the challenge to create a 360 degree animated infographic to explain with simple images where the money has been spent.

Data courtesy of http://usafacts.org
Report: https://usafacts.org/government-finances/spending?comparison=by_government_type&government_type=combined&table=spending--by-mission&year=2015

Infographic designed and animated by Erfan Dastournejad
More from this channel
-
 0:48
Designing Stages in VR with Microsoft Production Studios
-
 0:39
Tosolini Productions - 360 degree infographics and case studies
-
 1:32
STEP Ahead Awards - Women in Manufacturing - IntuiFace interactive experience
-
 0:42
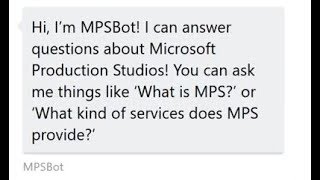
Microsoft Production Studios Chatbot
-
 1:00
Matterport Visualization in Hololens
-
 0:43
Interactive Projection Mapping at Microsoft Production Studios
-
 1:33
Apple 1 meets Apple ARKit at Living Computers: Museum + Labs
-
 0:43
Apple ARKit + IntuiFace multi-touch software