Crafting powerful data
224 views · Published 6 June 2018 · 1:01:37 · Indexed 27 October 2026
Channel: Tableau · 2018 · Science & Technology
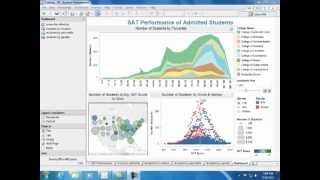
Learn techniques such as adding empathy and calls to action to create engaging visualizations with impact when using Tableau dashboard examples for varying use cases and goals. Explore progression of visualizations from descriptive to prescriptive, and predictive and discuss the efficacy of each.
More from this channel
-
 6:07
Tableau and Dallas Cowboys Merchandise Management
-
 0:30
Tableau Fun - Dive at 5
-
 2:43
Equinox IT Finds Insight in Millions of Rows of Telco Data
-
 1:56
How Cheyne Capital Uses Tableau
-
 2:07
Understanding Admitted Students
-
 2:12
How DePaul Univesity Uses Tableau
-
 3:33
Viz Talk - Apple vs. Microsoft Stock Performance
-
 1:36
How Mercer Uses Tableau