dotTrace Subsystems Deep Dive
4,295 views · Published 23 December 2013 · 9:46 · Indexed 12 November 2026
Channel: JetBrains · 2013 · Science & Technology
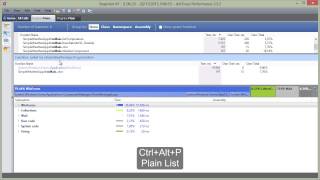
In this screencast we will have a look at the subsystems feature in dotTrace Performance.

The first time you profile an application and capture a snapshot, the amount of information displayed can be overwhelming.
Where to start? Should I inspect all threads? All calls? Do we need all these details to get a sense of where to look for issues?

Well, you will need these details over time but a good place to start is by examining subsystems. And that's what we will be doing in this screencast!

For more informations and examples, check our website and tutorial.


http://www.jetbrains.com/dottrace
http://confluence.jetbrains.com/display/NETCOM/Using+Subsystems+in+dotTrace+Performance
More from this channel
-
 58:19
Refactoring Legacy Code Bases with ReSharper
-
 27:51
Продуктовый маркетинг и управление проектами в JetBrains
-
 33:47
Оптимизация .NET приложений
-
 2:53
dotCover - How-to: Using TeamCity with dotCover
-
 1:28
dotCover How-to: Working with hotspots
-
 39:57
Objective-C Coding. 85 lvl - A JetBrains Day @FooCafé Presentation
-
 3:54
Smooth navigation within a dotTrace snapshot
-
 0:21
Welcome to JetBrains .NET Tools Evening in Prague