📚 Price Action: How to trade bearish belt hold candlestick pattern and bullish belt hold lines
2,181 views · Published 27 June 2018 · 14:10 · Indexed 21 October 2026
Channel: BO Turbo Trader · 2018 · Education
★★★ BECOME A PRO TRADER! ★★★

"Binary options are not promoted or sold to retail EEA traders. If you are not a professional client, please leave this page."

Reliable Binary Options Broker with a ★Profit of up to 100%★! Totally Free $10000 Demo account!

✅ Register and Get Best Trading Strategy ➤➤ https://cutt.ly/iq1

✅ #1 IQ Option ► https://cutt.ly/iq2

✅ #2 PocketOption ►https://goo.gl/Hs2a9k

✅ #3 Exnova ► https://cutt.ly/exnova

✅ #4 SabioTrade ► https://cutt.ly/jwSdeU1j

✅ #5 Quadcode  ► https://cutt.ly/RwSdruS8

🏬 BOTT Store ► https://goo.gl/Em3HHj

💡 Get a consultation ► https://www.wisio.com/boturbotrader "RISK WARNING: YOUR CAPITAL MIGHT BE AT RISK"
This video is not an investment advice.

"CFDs are complex instruments and come with a high risk of losing money rapidly due to leverage. Between 74-89% of retail investor accounts lose money when trading CFDs. You should consider whether you understand how CFDs work and whether you can afford to take the high risk of losing your money."

Binary Options Turbo Trader (#BOTT)
https://goo.gl/95wWoZ

Forex (FX) Turbo Trader (FOTT)
https://goo.gl/GcPh46

DO (Digital Options) Turbo Trader (DOTT)
https://goo.gl/DRThwk

🎓 Join the BOTT Mentorship Program!
📧 [email protected]

🎬 BOTT Mentorship Self-Study Video Packs
https://goo.gl/DkDFqb

📚 BO Turbo Trader Price Action Guide for Binary Options Trader PDF
https://goo.gl/J2aUqe

📚 BO Turbo Trader Price Action Bible for Binary Options Trader PDF
https://goo.gl/en48Ux

👉 SMASH THE LIKE BUTTON 👈
👉 HIT THE SUBSCRIBE BUTTON 👈
👉 LEAVE A COMMENT 👈
👉 SHARE 👈


Facebook-Group: https://www.facebook.com/groups/boturbotrader/

Twitter:
https://twitter.com/boturbotrader

Blogger:
https://boturbotrader.blogspot.com/


Risk Warning: Your invested capital may be at risk.
This video is not an investment advice.

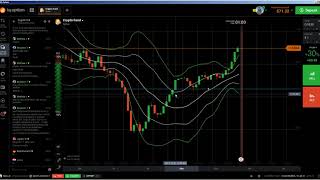
Indicators:
EMA 3     (blue)
EMA 20   (yellow)
EMA 50   (orange)
EMA 100 (red)
EMA 200 (purple)

Bollinger Band Period 20 Deviation 2 (green)
Bollinger Band Period 20 Deviation 1 (white)

A candlestick pattern that forms during an upward trend. This is what happens in the pattern: following a stretch of bullish trades, a bearish or black candlestick.  Have you spotted a Bearish Belt Hold candlestick pattern? Today we're discussing its formation, its meaning, and how you should interpret its appearance. Bearish Belt Hold is a single candlestick pattern, basically, a Black Opening Marubozu that occurs in an uptrend.

The Belt Hold lines are formed by single Candlesticks. The Bullish Belt Hold is a long white candle that has gapped down in a downtrend. From it’s opening point, it moved higher for the rest of the day. This is called a White Opening Shaven Bottom or White Opening Marubozu. The bearish Belt Hold is just the opposite. It is formed with a severe gap away from the existing uptrend. It opens at its high and immediately backs off for the rest of the day. It is known as a Black Opening Shaven head or Black Opening Marubozu. Yorikiri, a sumo wrestling term, means pushing your opponent out of the ring while holding onto his belt. The longer the body of the Belt Hold, the more significant the reversal.

The Belt-Hold candlestick pattern (or yorikiri as it is know in Japanese) is considered a minor trend reversal pattern that can indicate a bullish or bearish trend. You are now looking at a chart which shows the bullish belt hold line candlestick pattern. As you see, the trading day starts with a big bearish gap. bullish belt hold appears in downtrends. The pattern can be recognized by a single long, full bodied candlestick that is bullish.

A bearish belt-hold is a long black candlestick that opens on, or near, its high and closes well off its open. A belt hold line is a single candlestick pattern. A bullish belt hold occurs when prices open on the low of the day and then immediately move higher.

belt hold
bullish belt hold
bearish belt hold
belt hold lines
bearish belt hold candlestick pattern
candlestick patterns
closing marubozu
bullish belt hold meaning
breakaway pattern
harami pattern
bullish harami
bullish belt hold candlestick pattern
bearish belt hold means
bearish engulfing
bullish harami
closing marubozu
bullish engulfing
matching low candlestick pattern
bearish kicking pattern

stick sandwich pattern
doji sandwich pattern
bullish doji sandwich
candlestick patterns
green candle stock
types of candlesticks and their meaning
what is candlestick
bearish doji sandwich
candlestick patterns
More from this channel
-
 13:15
💵 How to make 100% net profit in 13 minutes and 14 seconds - IQ Option Trader
-
 11:46
📈 Price Action: How to trade Spinning Tops / High Wave Candlesticks the right way - BO Turbo Trader
-
 10:47
📈 Price Action: How to trade Engulfing Candlestick Pattern the right way - IQ Option
-
 19:38
📈 Price Action: How to spot fake setup and false Candlesticks and avoid them - IQ Option - BO Turbo
-
 9:07
💵 77% net profit in 8 minutes on iq option real account and iq option tutorial
-
 5:42
💵 77% net profit in 5 minutes on IQ Option Real Account Strategy and IQ Option Real Account Tricks
-
 4:50
💵 85% net profit in 4 minutes IQ Option REAL Account Trading Method and iq option live trading
-
 4:11
💵 64% net profit in 3 minutes on iq option tips and tricks iq option real account tricks