📚 Price Action: How to read overbought and oversold w/ & without indicators rsi, cci, stochastic
3,131 views · Published 16 June 2018 · 31:12 · Indexed 24 September 2026
Channel: BO Turbo Trader · 2018 · Education
★★★ BECOME A PRO TRADER! ★★★

"Binary options are not promoted or sold to retail EEA traders. If you are not a professional client, please leave this page."

Reliable Binary Options Broker with a ★Profit of up to 100%★! Totally Free $10000 Demo account!

✅ Register and Get Best Trading Strategy ➤➤ https://cutt.ly/iq1

✅ #1 IQ Option ► https://cutt.ly/iq2

✅ #2 PocketOption ►https://goo.gl/Hs2a9k

✅ #3 Exnova ► https://cutt.ly/exnova

✅ #4 SabioTrade ► https://cutt.ly/jwSdeU1j

✅ #5 Quadcode  ► https://cutt.ly/RwSdruS8

🏬 BOTT Store ► https://goo.gl/Em3HHj

💡 Get a consultation ► https://www.wisio.com/boturbotrader "RISK WARNING: YOUR CAPITAL MIGHT BE AT RISK"
This video is not an investment advice.

"CFDs are complex instruments and come with a high risk of losing money rapidly due to leverage. Between 74-89% of retail investor accounts lose money when trading CFDs. You should consider whether you understand how CFDs work and whether you can afford to take the high risk of losing your money."

Binary Options Turbo Trader (#BOTT)
https://goo.gl/95wWoZ

Forex (FX) Turbo Trader (FOTT)
https://goo.gl/GcPh46

DO (Digital Options) Turbo Trader (DOTT)
https://goo.gl/DRThwk

🎓 Join the BOTT Mentorship Program!
📧 [email protected]

🎬 BOTT Mentorship Self-Study Video Packs
https://goo.gl/DkDFqb

📚 BO Turbo Trader Price Action Guide for Binary Options Trader PDF
https://goo.gl/J2aUqe

📚 BO Turbo Trader Price Action Bible for Binary Options Trader PDF
https://goo.gl/en48Ux

👉 SMASH THE LIKE BUTTON 👈
👉 HIT THE SUBSCRIBE BUTTON 👈
👉 LEAVE A COMMENT 👈
👉 SHARE 👈


Facebook-Group: https://www.facebook.com/groups/boturbotrader/

Twitter:
https://twitter.com/boturbotrader

Blogger:
https://boturbotrader.blogspot.com/


Risk Warning: Your invested capital may be at risk.
This video is not an investment advice.

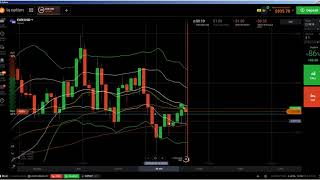
Indicators:
EMA 3     (blue)
EMA 20   (yellow)
EMA 50   (orange)
EMA 100 (red)
EMA 200 (purple)

Bollinger Band Period 20 Deviation 2 (green)
Bollinger Band Period 20 Deviation 1 (white)

Overbought means an extended price move to the upside; oversold to the downside. When price reaches these extreme levels, a reversal is possible. The Relative Strength Index (RSI) can be used to confirm a reversal. DEFINITION of 'Overbought' Overbought refers to a situation in which the demand for a certain asset or security unjustifiably pushes the price of that asset or underlying asset to levels that are not justified by fundamentals.

Two of the most common indicators of overbought or oversold conditions are the relative strength index (RSI) and the stochastic indicators. RSI levels of 80 or above are considered overbought, as this indicates an especially long run of successively higher prices. An RSI level of 30 or below is considered oversold. Developed by J. Welles Wilder, the Relative Strength Index (RSI) is a momentum oscillator that measures the speed and change of price movements.

The Relative Strength Index (RSI), developed by J. Welles Wilder, is a momentum oscillator that measures the speed and change of price movements. The RSI oscillates between zero and 100. Traditionally the RSI is considered overbought when above 70 and oversold when below 30. Overbought means an extended price move to the upside; oversold to the downside. When price reaches these extreme levels, a reversal is possible. The Relative Strength Index (RSI) can be used to confirm a reversal.

Oversold is a condition in which the price of an underlying asset has fallen sharply to a level below where its true value resides. This condition is usually a result of market overreaction or panic selling and is generally considered short term in nature. Bound momentum indicators are best suited for overbought/oversold analysis. Basically, there are two types of momentum oscillators: bound and unbound. Bound oscillators, such as RSI and the Stochastic Oscillator, fluctuate within a specific range, zero to one hundred in this case.

The relative strength index (RSI) is a technical indicator used in the analysis of financial markets.

overbought and oversold
overbought oversold indicators
rsi overbought oversold
difference between overbought and oversold
overbought oversold indicator mt4
oversold stocks
overbought stocks list
should i buy oversold stock
More from this channel
-
 6:16
📈 Price Action: How to trade trending markets (uptrend/downtrend), find trending markets 2018 today
6:16
📈 Price Action: How to trade trending markets (uptrend/downtrend), find trending markets 2018 today
-
 13:43
📈 Price Action: How to trade binary IQ Option, live binary options, IQ Option online options trading
13:43
📈 Price Action: How to trade binary IQ Option, live binary options, IQ Option online options trading
-
 9:17
📈 Price Action: IQ Option strategy live trading m and w trading strategy advanced trendline strategy
9:17
📈 Price Action: IQ Option strategy live trading m and w trading strategy advanced trendline strategy
-
 13:58
📈 Price Action: IQ Option live trading best binary options strategy for beginners 2018 easy
13:58
📈 Price Action: IQ Option live trading best binary options strategy for beginners 2018 easy
-
 19:09
📚 Price Action: How to trade broadening top and broadening bottom, broadening channel, formation
19:09
📚 Price Action: How to trade broadening top and broadening bottom, broadening channel, formation
-
 16:14
📈 Price Action: live trading iq option easy binary options strategy, binary option winning tricks
16:14
📈 Price Action: live trading iq option easy binary options strategy, binary option winning tricks
-
 11:13
📈 Price Action: iq option live price action trading system, trading price action trends strategies
11:13
📈 Price Action: iq option live price action trading system, trading price action trends strategies
-
 8:41
📈 Price Action: iq option live trading 30 second binary options strategy, 30 seconds strategy 2018
8:41
📈 Price Action: iq option live trading 30 second binary options strategy, 30 seconds strategy 2018