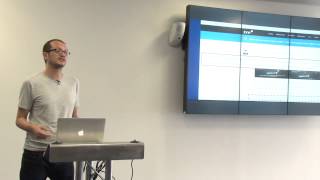
Thomas Caswell | Interactive multi scale time series exploration with matplotlib
1,367 views · Published 24 October 2016 · 1:00:57 · Indexed 22 October 2026
Channel: PyData · 2016 · Science & Technology
PyData DC 2016

This tutorial is an introduction to how to matplotlib's event handling system to build an tool for interactively exploring multi-scale time series data.

The primary example will be how to 'drill down' through summary data sets to view the underlying data using hourly weather data from NOAA. 00:00 Welcome!
00:10 Help us add time stamps or captions to this video! See the description for details.

Want to help add timestamps to our YouTube videos to help with discoverability? Find out more here: https://github.com/numfocus/YouTubeVideoTimestamps
More from this channel
-
 31:23
Kostas Perifanos - Authorship Attribution Using Python
-
 31:08
Prash Majmudar - Measuring the Digital Economy Using Big Data
-
 36:26
Ian Ozsvald - The High Performance Python Landscape
-
 37:48
Mike Muller - Shared Memory Parallelism with Python
-
 35:01
Martin Goodson - Most Winning A/B Test Results are Illusory
-
 30:19
Mark Basham - Python for High Throughput Science
-
 1:13:42
David Cournapeau & Simon Jagoe - Narrowing the Gap Between Array Computing and Databases
-
 31:38
Emlyn Clay - Phython, Pharmaceuticals & Discovery