Basics of editing Data Driven Visual PowerPoint Graphs Pack
2,489 views · Published 20 April 2016 · 11:54 · Indexed 14 October 2026
Channel: Presentation Process · 2016 · Howto & Style
Graphs Pack : https://www.presentation-process.com/powerpoint-graphs-gallery.html
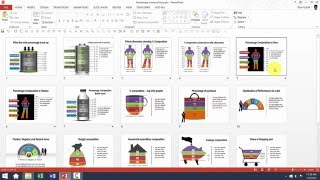
Basics of editing Data Driven PowerPoint Graphs from Visual Graphs Pack . Learn how to add your own data, change colors of lines in line chart,  increase label font sizes,  alter chart elements and more.
More from this channel
-
 6:45
PowerPoint Photoframe : PowerPoint Effects Tutorial Series
-
 5:12
How To Resize 3D Shapes in PowerPoint : Tips and Tricks Series
-
 3:31
PowerPoint CEO Pack 1 Intro Video
-
 5:01
Custom Your Data Driven BAR Charts in PowerPoint Graphs Pack
-
 5:37
Custom Your Data Driven LINE Charts in PowerPoint Graphs Pack
-
 3:17
Custom Your Data Driven PIE Charts With Second Level Detail
-
 5:38
Help Video: Customize Currency Composition Charts in Graphs Pack
-
 3:37
Help Video: Customize Percentage Composition Charts in Graphs Pack