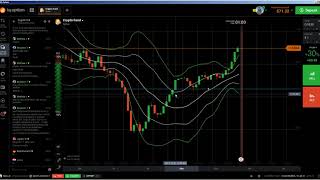
📈 Price Action: IQ Option live trading 1 minute candlestick, candlestick scalping, ranging market
2,693 views · Published 22 February 2018 · 8:11 · Indexed 28 October 2026
Channel: BO Turbo Trader · 2018 · Education
Facebook-Group: https://www.facebook.com/groups/bott.mentorship ★★★ BECOME A PRO TRADER! ★★★

"Binary options are not promoted or sold to retail EEA traders. If you are not a professional client, please leave this page."

Reliable Binary Options Broker with a ★Profit of up to 100%★! Totally Free $10000 Demo account!

✅ Register and Get Best Trading Strategy ➤➤ https://cutt.ly/iq1

✅ #1 IQ Option ► https://cutt.ly/iq2

✅ #2 PocketOption ►https://goo.gl/Hs2a9k

✅ #3 Exnova ► https://cutt.ly/exnova

✅ #4 SabioTrade ► https://cutt.ly/jwSdeU1j

✅ #5 Quadcode  ► https://cutt.ly/RwSdruS8

🏬 BOTT Store ► https://goo.gl/Em3HHj

💡 Get a consultation ► https://www.wisio.com/boturbotrader "RISK WARNING: YOUR CAPITAL MIGHT BE AT RISK"
This video is not an investment advice.

"CFDs are complex instruments and come with a high risk of losing money rapidly due to leverage. Between 74-89% of retail investor accounts lose money when trading CFDs. You should consider whether you understand how CFDs work and whether you can afford to take the high risk of losing your money."

Binary Options Turbo Trader (#BOTT)
https://goo.gl/95wWoZ

Forex (FX) Turbo Trader (FOTT)
https://goo.gl/GcPh46

DO (Digital Options) Turbo Trader (DOTT)
https://goo.gl/DRThwk

🎓 Join the BOTT Mentorship Program!
📧 [email protected]

🎬 BOTT Mentorship Self-Study Video Packs
https://goo.gl/DkDFqb

📚 BO Turbo Trader Price Action Guide for Binary Options Trader PDF
https://goo.gl/J2aUqe

📚 BO Turbo Trader Price Action Bible for Binary Options Trader PDF
https://goo.gl/en48Ux

👉 SMASH THE LIKE BUTTON 👈
👉 HIT THE SUBSCRIBE BUTTON 👈
👉 LEAVE A COMMENT 👈
👉 SHARE 👈


Facebook-Group: https://www.facebook.com/groups/boturbotrader/

Twitter:
https://twitter.com/boturbotrader

Blogger:
https://boturbotrader.blogspot.com/


Risk Warning: Your invested capital may be at risk.
This video is not an investment advice.

Indicators:
EMA 3     (blue)
EMA 20   (yellow)
EMA 50   (orange)
EMA 100 (red)
EMA 200 (purple)

Bollinger Band Period 20 Deviation 2 (green)
Bollinger Band Period 20 Deviation 1 (white)

How to analyse candlestick chart- 1 minute candlestick live trading. analysis & strategy | How to trade 1 minute candlestick with indicator. There are differences between a one-minute chart and a tick chart. See the pros and cons of each to pick the best chart type for your day trading. They provide the same information, except candlesticks are color coded and easier to see.

Also, it is more difficult to be as accurate with these trades as the 15-minute trades, due to the inherent level of noise on the 1-minute chart, in my opinion. In other words, when trading 60-second options from the 1-minute chart, you're dealing with a very small amount of price data encapsulated in each candlestick. Candlestick patterns are useful for both short and long-term trades as these patterns occur on one minute charts right up to weekly charts (or longer). Looking at a chart you'll see lots of patterns, the key is to understand which ones are really signals and which ones are just random market movements. Producing the right combination of time segments can formulate low-risk, high potential day trading setups.

Stock Index Futures traders often use the 1minute charts to enter and exit trades. Forex day traders can also gain an advantage by getting in on a move right as it happens by watching the 1 minute charts. The type of chart set up that we use to trade the 1 minute charts is candlestick charts. Online you'll see a lot of day trading 1, 5, 15 and 30-minute charts. All chart types have a time frame, usually the x-axis, and that will determine the amount of trading information they display. Whilst most are based on time, some will focus on numbers of trades.

Their made up of the same information, what you're seeing on the daily chart is just 24 1 hour candles combined together to make one daily candle. Throughout the hour the lowest price that the sellers pushed the EUR/USD to 1.2956.

1 minute candlestick chart live
one minute chart trading strategies
trading 1 minute charts
iq option candlestick analysis
candlestick pattern trading strategy
how to read candlestick chart for day trading youtube
candlestick patterns
candle stick chart youtube

Binary Signals 5 Minutes
Binary Signals Olymp Trade
Binary Signals Site
Winning Binary Signals
Olymp Trade Strategy
Olymp Trade Tricks
Binary Options Tricks
#iqoption
#expertoption
More from this channel
-
 13:15
💵 How to make 100% net profit in 13 minutes and 14 seconds - IQ Option Trader
-
 11:46
📈 Price Action: How to trade Spinning Tops / High Wave Candlesticks the right way - BO Turbo Trader
-
 10:47
📈 Price Action: How to trade Engulfing Candlestick Pattern the right way - IQ Option
-
 19:38
📈 Price Action: How to spot fake setup and false Candlesticks and avoid them - IQ Option - BO Turbo
-
 9:07
💵 77% net profit in 8 minutes on iq option real account and iq option tutorial
-
 5:42
💵 77% net profit in 5 minutes on IQ Option Real Account Strategy and IQ Option Real Account Tricks
-
 4:50
💵 85% net profit in 4 minutes IQ Option REAL Account Trading Method and iq option live trading
-
 4:11
💵 64% net profit in 3 minutes on iq option tips and tricks iq option real account tricks